Thanks to Greg Cailliet for suggestions and corrections.
Here, I'm presenting a two-stage matrix model using juvenile and adult stage assuming seasonal parturition (birth-pulse) in combination with postbreeding census. Maturing juveniles are in fact first-time-pregnant adults with adult survival probability. This produces a 2x2 matrix. If exchange between 5 different populations were included, then the resulting matrix would be 10x10. If males were added for all 5 populations, we would have to deal with a manageable 20x20 matrix. Should check my notes why it might be preferable to use an extra stage of 1 yr duration as a "starter" stage.
Duration of first stage T(1) = 14 years;
Longevity about 60 years (Cailliet et al. 1983, and using 5 ln2/k),
Duration of second stage T(2) = 46years.
Mortality, assume M = -ln(0.01)/60 = 0.07675 yr-1, (S = 0.9261) based on longevity of 60 years.
Fecundity, used mean litter size of mean of 8.9 (Francis 1996)
every third year (Mollet et al. 2000), i.e. effective annual female
fecundity of 8.9/(2x3) = 1.4833. Mollet et al. (2000) presented evidence
that the gestation time of the white shark is 18 months but forgot to
suggest that the reproductive cycle is accordingly most likely 3 years
long. Uchida et al. (1996) reported a litter of 10 with a total estimated
mass of 263 kg (17.2% of1528 kg mass of female).
( A model using pregnant and resting stages in combination with actual
female fecundity would be better and produce a higher lambda, but here
I wanted to present the smallest matrix possible. The difference is substantial
for a species with a low age-at-maturity).
Sigma (i) = P (survival of an indiviudal in stage i)
Gamma (i) = P (growth from i to i+1 | survival) = growth probability for
surviving individuals
G(i) = sigma (i) gamma (i)
P(i) = sigma (i) (1-gamma (i) )
I used a fixed stage duration for both juveniles and adults. I can calculate
gamma (1) from equation 6.l14 on p. 164 in Caswell (2000) and gamma (2)
from equation 6.103 on p. 161 and then calculate G(i) and P(i). It's an
iterative process. Assume lambda = 1, calculate G(i)'s and P(i)'s, solve
2x2 matrix for lambda, continue until assumed lambda agrees with calculated
lamdda.
In this case, the elements of the projection matrix A are :
P(1) = 0.9062; P(2) = 0.9260;
G(1) = 0.01993;
Fertility F(2) = m(2) x S(2) = 1.4833 x 0.9261 = 1.3737.
Then we decompose the A-matrix into a transition matrix T and fertility matrix F (A = T + F).
|
A
=
|
0.9062
|
1.3737
|
T
=
|
0.9062
|
0
|
F
=
|
0
|
1.3737
|
||
|
0.01993
|
0.9260
|
0.01993
|
0.260
|
0
|
0
|
Lambda 1 = 1.0819, growth rate of stable population (r = ln (lambda 1) = 0.07869 yr-1)
(lambda 2 = 0.7503, will determine how fast stable populaton is reached)
Age structure (right eigenvector for lamda 1 of A): w1 (juveniles)= 88.7%, w2 (adults)= 11.3% ;
Reproductive values (left eigenvector for lamda 1 of A): v1 (juveniles at age 0) = 1.00, v2 (adults at age 14 yr, i.e at beginning of stage) = 8.8. (Note that the % values of individuals in an age-structured Leslie matrix or life history table can be added to obtain a approximate % value of indiviuals in a stage, but that the reproductive values are not additive.)
elasticity matrix (relative change of lamda with respect to relative change of matrix elements
i.e. d ln( lamda)/d ln (aij):
| S = | 0.4701 | 0.06012 | E= | 0.3938 | 0.07634 | ||
| 4.1434 | 0.5299 | 0.07634 | 0.4535 |
The elasticity (0.07634) of the fertility matrix element (F2 = 1.3894) is much smaller than the elasticities (0.384 and 0.450) of the in-stage survival matrix elements (P1 = 0.9062 and P2 = 0.9260, respectively). Changing fecundity (m2) and thus fertility (F2) by, say a factor of 2, has a much smaller effect on lamda than changing P by the same amount.
Solution using life cycle graphs: Here I selected the width of the arrows to be proportional to the elasticity of the matrix elements and the size ot the nodes to be proportional to a) the age structure (W-vector), b) the reproductive values (V-vector). Note that the width difference of the arrows cannot be seen on a computer screen unless the differences are large.
a) 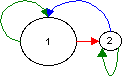 b)
b)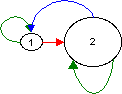
|
N
= |
10.7 |
0 |
|
2.87 |
13.5 |
- The matrix elements give the mean time spent in each stage. Thus a white shark spends, on average 10.7 years as an immature and 3.8 years as a reproductive adult. A mature adult, in contrast, spends an average of 14-15 years in that stage. The sum of the columns give the mean time to death (= life expectancy; 14.4 yr for juveniles and adults). Here the warning in Mollet & Cailliet (2003) applies because stage-based model distort the timing. If age-at-first reproduction is 15 yr, then on average an individual will be immature for ~ 15 yr, not 10.7 yr.
|
R
=
|
3.9442
|
18.563
|
|
0
|
0
|
A juvenile white shark can expected to produce 5.2 female offspring during its life-time (offspring is produced when it has become mature). The generation time T is ln Ro/ln lambda = 17.4. Mu1 can be calculated from the matrix (F N2) and is 24.2. Should add Abar.
Following Coale, A. J. (1972). The growth and structure of human populations.
Princeton University Press, Princeton NJ, 227p:
The generation time T is defined by e(rT) = Ro (net reproductive
rate). It is the time T required for the population to increase by a
factor of Ro. The concept is the same when one calculates
a doubling time, the time T1/2 required for the population
to increase by a factor of 2 or a half-life T1/2 in the case
of a decreasing (=decaying) population. However, T is not, somewhat
surprisingly, equal to any of the several mean ages of childbearing
that can be defined.. There are three mean ages of fertility of interest
in this context:
1) the mean age (m bar) of the fertility schedule (mean age of childbearing
in a cohort subject to no mortality),
2) the mean age (mu1) of the net fertility schedule (mean age of childbearing
in a cohort),
3) the mean age (A bar) of childbearing in the stable populaton.
(See Coale (1972) or Caswell (2000) for equations).
What is missing? I should provide a confidence interval for lambda, the growth rate of the stable population. In this particular case and most other demographic analyses for sharks, only a Monte Carlo uncertainty analysis is possible because available demographic data is based on estimates of fertility and little data on survival is available. We cannot use a series approximation (sometime called the "delta method") because the variance of the parameters is not known. We cannot use a bootstrap method because the resampling procedure requires the history of individuals to be known.
See Caswell (2000) and Coale and Demeny (1966) how survivorship can be estimated from other species using model life tables. The life tables of other species are re-scaled according to age-at-first reproduction. The lemon shark would be the first species to be included for the construction of a model life table. Perhaps life tables of marine mammals (e.g. whales) should be included. We cannot use a stage-based matrix model to do this, we need to use an age-based matrix model (= Leslie matrix).